Adding metadata
Right now, when we look at our cases, they don’t have attributes or metadata:
Now we will create ‘case classifications’, bringing in the metadata related to each file or individual.
This could be any number of things, for example socio-demographics like age or gender, or that person’s response to a survey.
Metadata file
In the project files you downloaded, in the folder ‘research tools’, open and check the excel sheet entitled ‘metadata’:
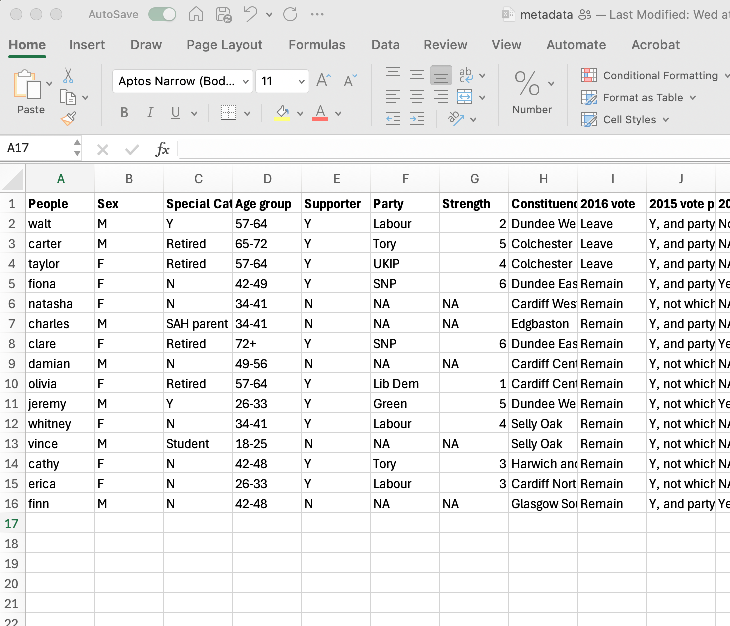
This file contains information on our participants from the 2016 interviews. We are trying to match this with our existing case classification of ‘People’, so we need to make sure it’s formatted the same way to enable it to match.
So check that:
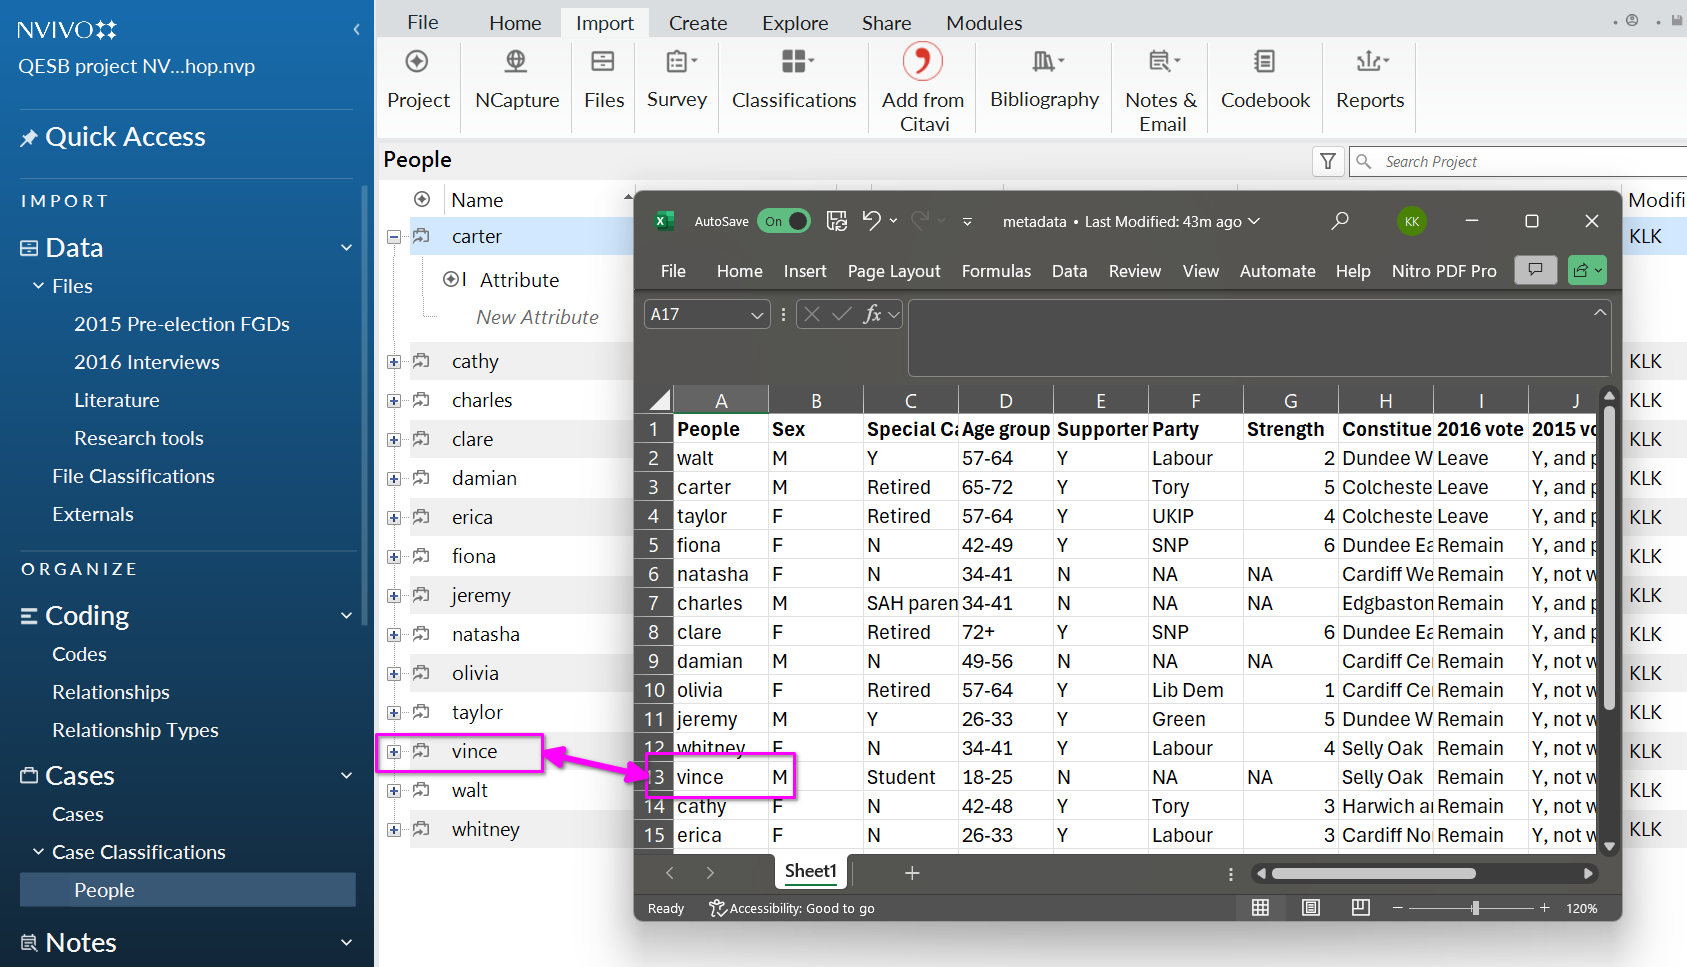
The first column - ‘People’- indicate the cases. Check this is typed the same way in your Nvivo project setup.
The names in this first column should match the formatting of the cases and the interview file names in Nvivo - and this is case sensitive (i.e. if it’s vince it must also be ‘vince’ and not ‘Vince’)
NB: NVivo for macOS: Nvivo specifies that you use a csv file rather than an excel file, which you will find in the folder too. However the same situation applies - you need to ensure that the cases you have created are in a similar format to the csv file. That is, if they are all in lower case, the csv file must also be all in lower case. If the cases are capitalised (e.g. ‘Vince’ the csv file must also ‘Vince’).
Import classification sheet
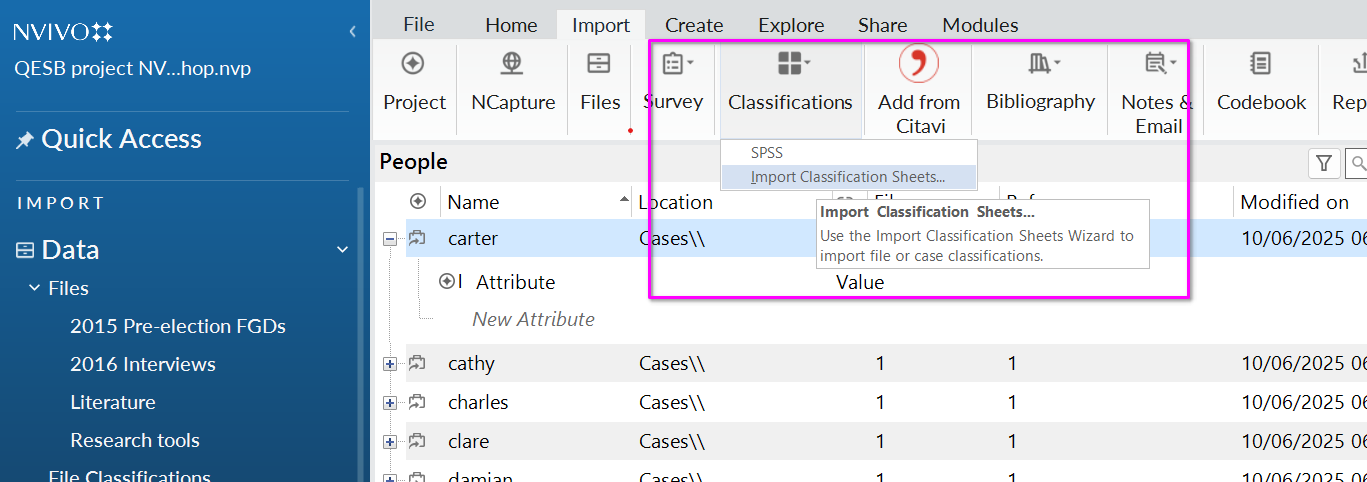
- From the Import ribbon tab, select ‘classifications’ and then ‘Import classification sheets’.
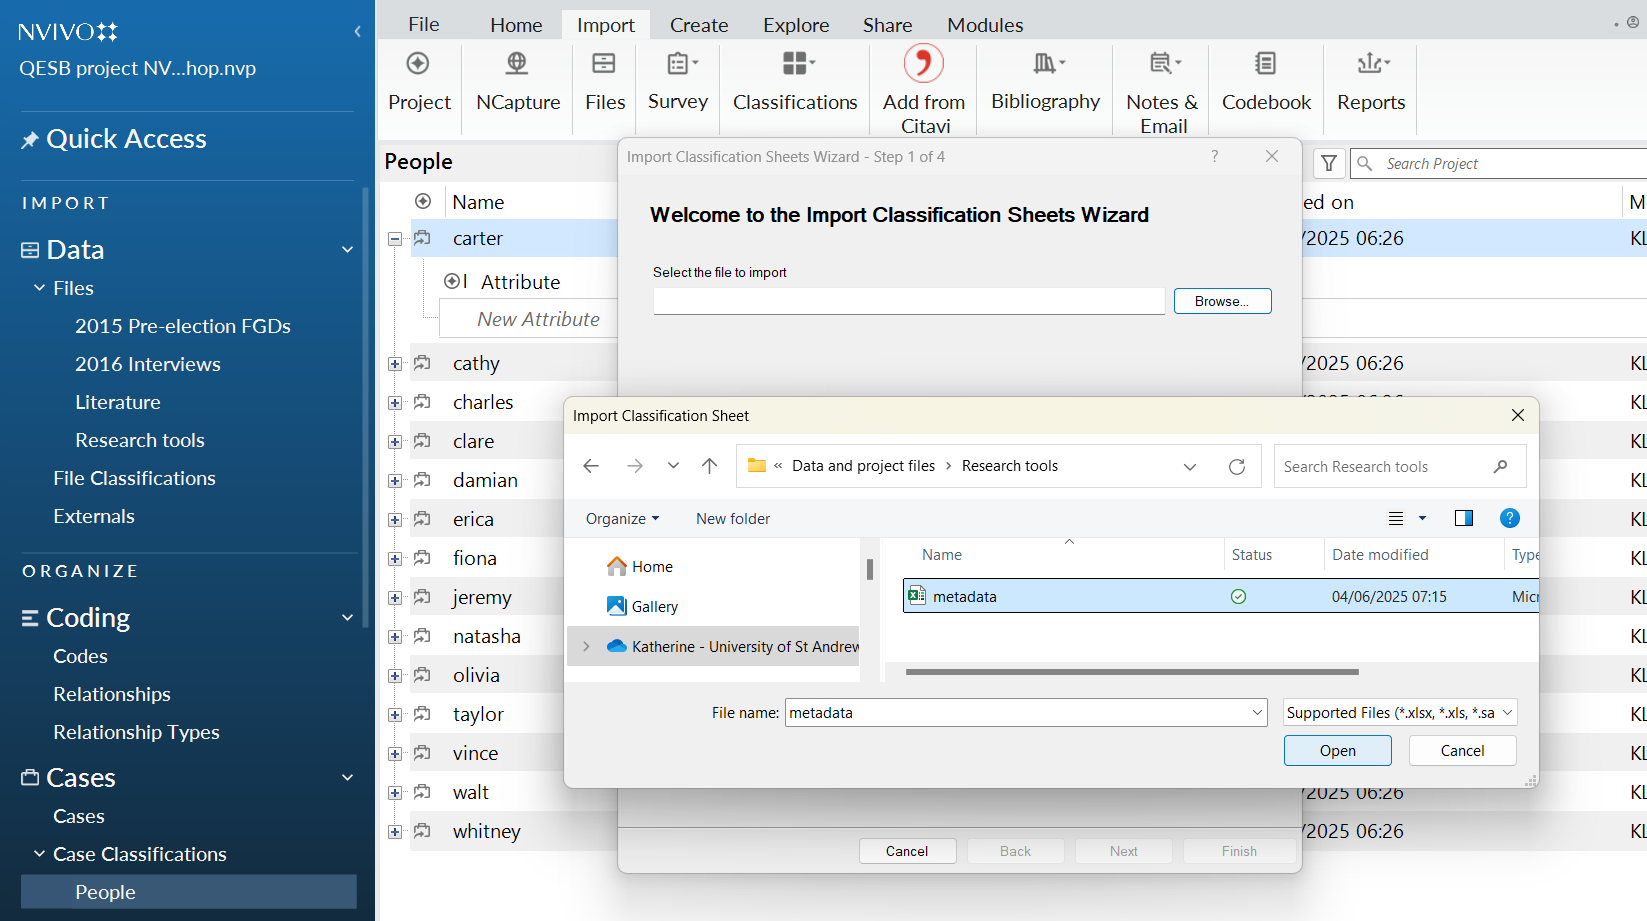
Select the ‘metadata.xls’ file from the ‘Research tools’ folder. ( NVivo for macOS: import the csv file instead.)
Click Open to select file.
Then click Next on the import Wizard:
NVivo for macOS: this import wizard looks a bit different.
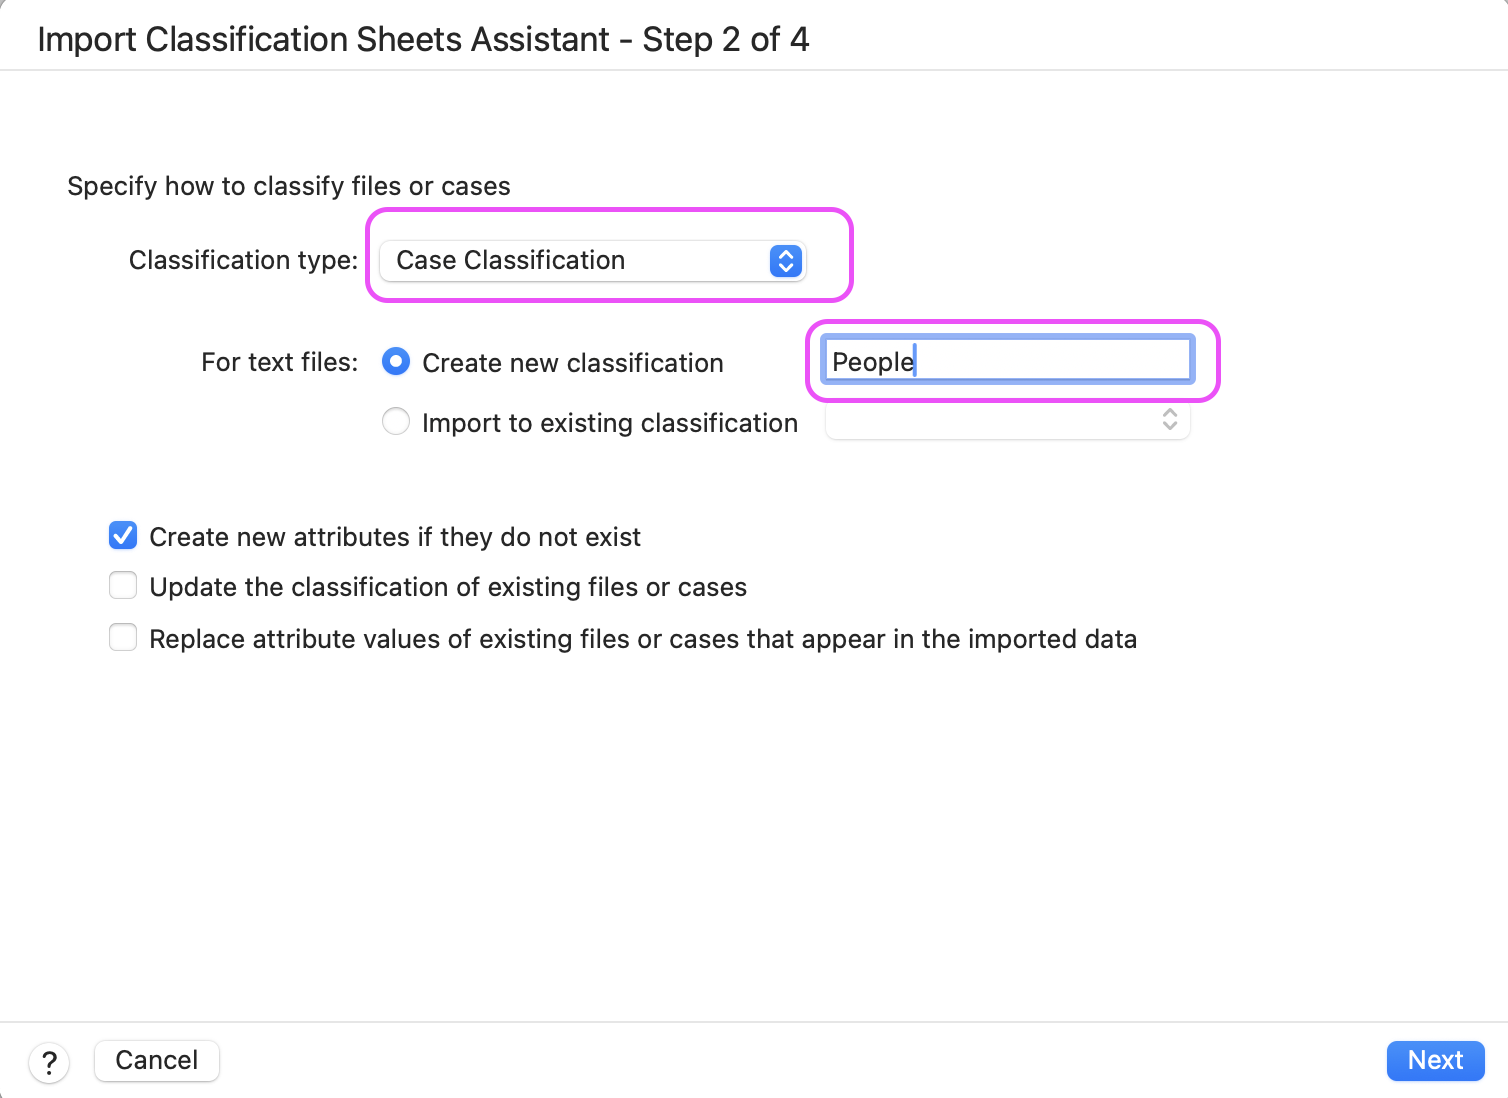
- Set classification type as ‘case classification’.
NVivo for macOS: here create new case classification ‘People’ (Windows users have done this step earlier).
You can select or deselect if you want to create new attributes, update existing classifications, or replace existing attribute values.
- Click Next.
N.B. to set up ‘file classifications’, follow the same process but select ‘file classifications’ here (might include similar demographic info as well as things like location of interview, who interviewer was, time, date, etc.)
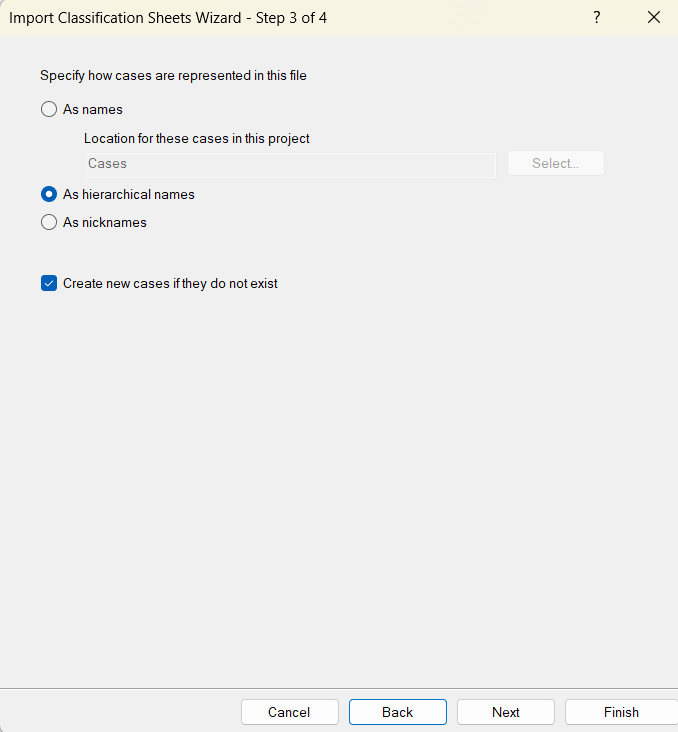
Choose to represent files ‘as hierarchical names’; click next.
NB. NVivo for macOS: This option is not available on macOS - just click through.
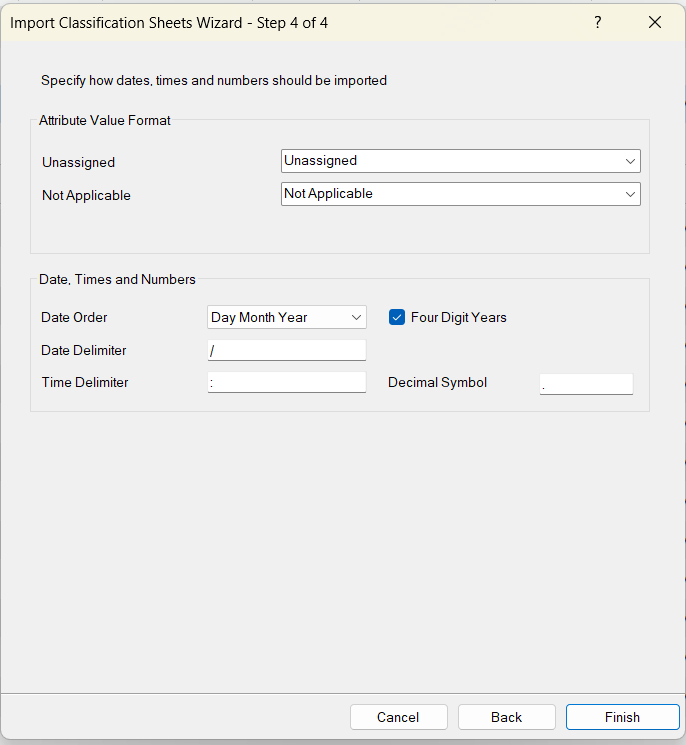
Select how you want blank attributes, dates, time and numbers to be represented.
NB. NVivo for macOS: Step 4 is not available on mac, just click through.
- Click finish.
Now, check that case info has been imported to existing ‘People’ classification. You can see that the first row of the excel sheet linked with the cases that already existed, and now you have columns indicating exactly the columns that were in the spreadsheet.

Manually add new cases
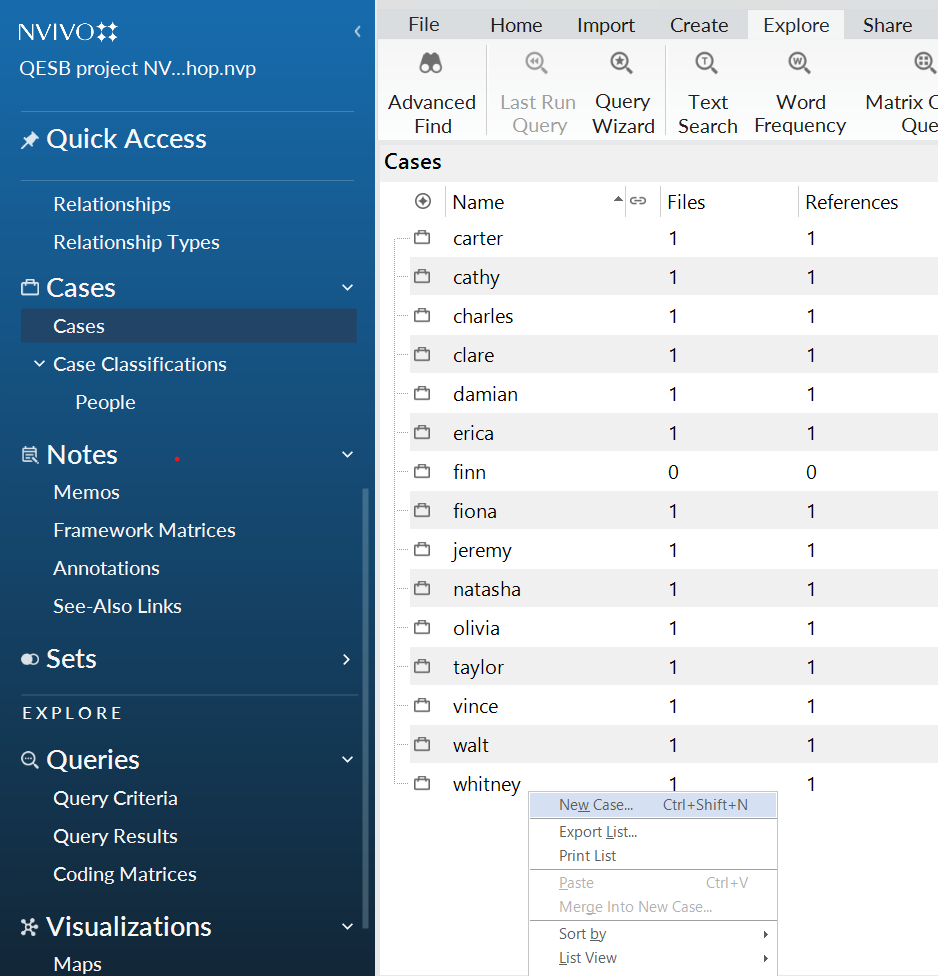
Click on the ‘cases’ on left hand menu, then right click on the open space in the ‘List View’ under your cases and select ‘New Case’, or use shortcut or Ctrl+Shift+N.
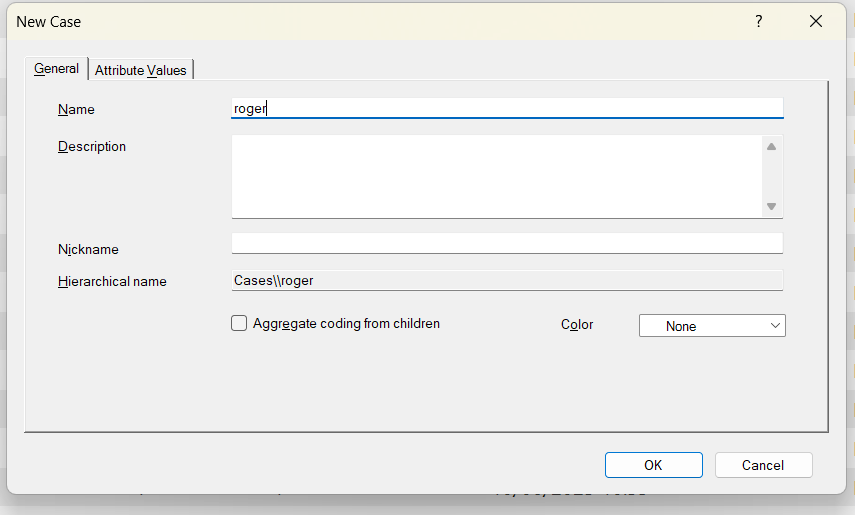
- Input any name / description for the case under ‘General’
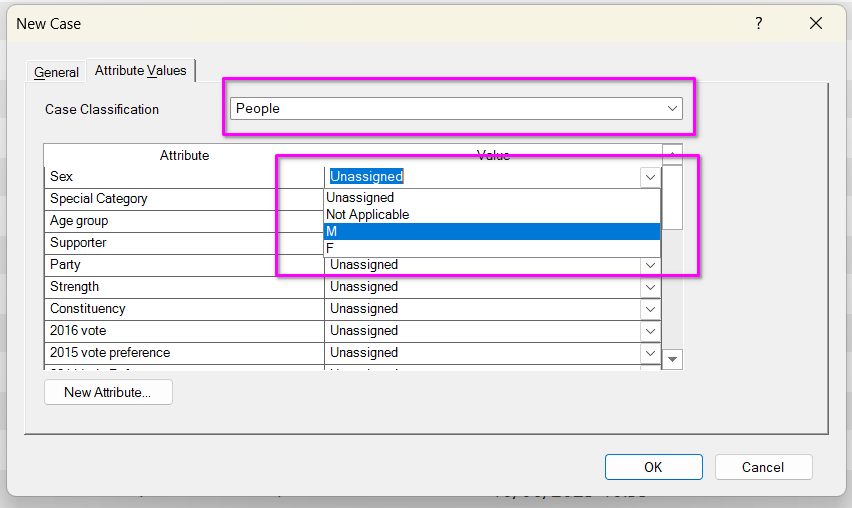
- Select relevant attributes under ‘Attribute values’
- Select case classification as ‘People’
- You can assign values from the drop down box for each attribute
Select OK.
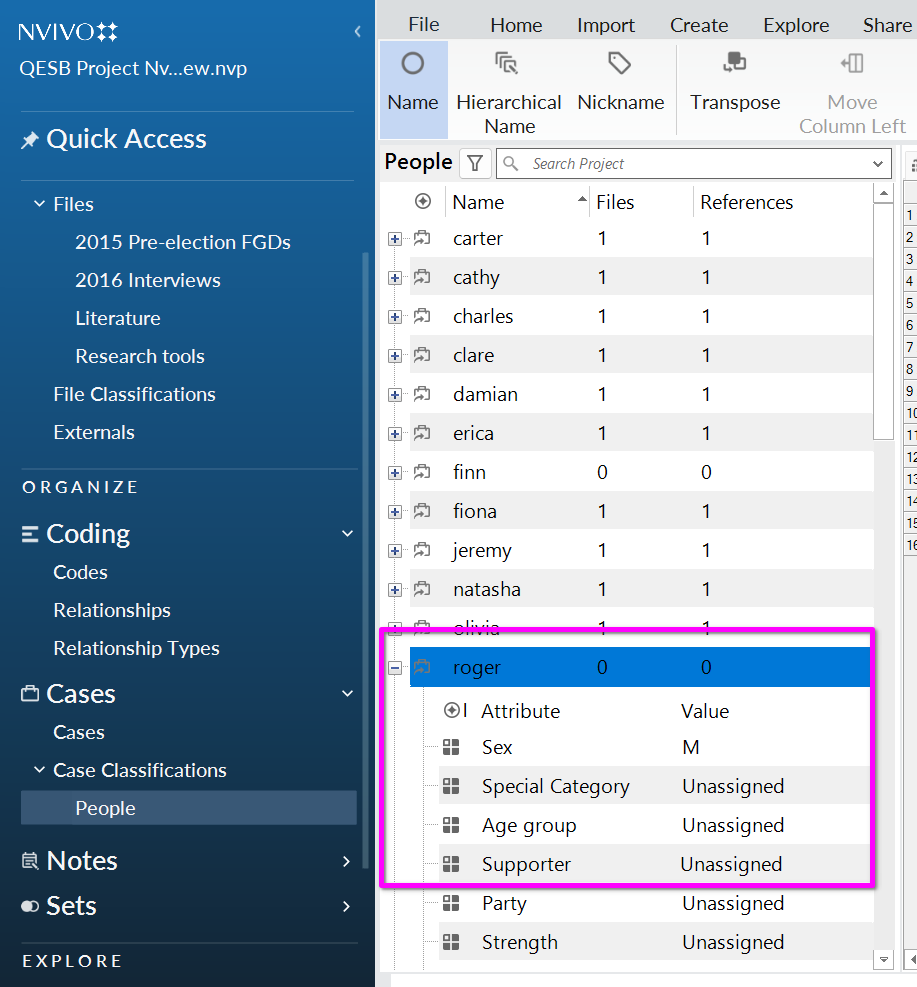
You can see a new case for ‘roger’ has been set up; it doesn’t have any files or attributes attached yet.
NVivo for macOS: the stages of setting up a new case are similar, but the menus might look a bit different.
Create new attributes for an existing case
You might want to create a new attribute i.e. a new column in the metadata for some feature which varies between your cases.
We are going to create a new attribute ‘2015 pre-election’ that indicates whether they also took part in the 2016 pre-election focus group.
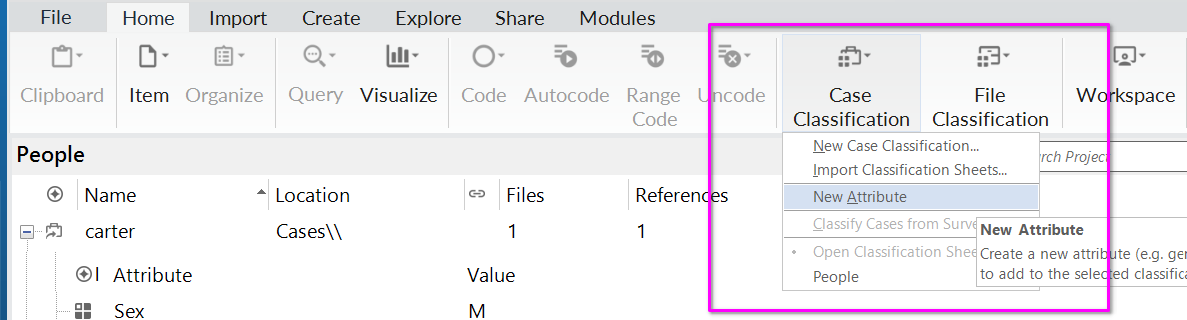
Click on Case Classifications-> People
In the home ribbon, go to Case classification -> new attribute
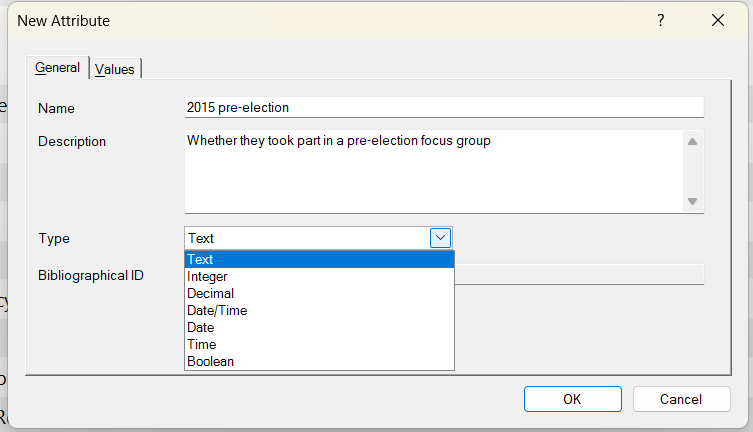
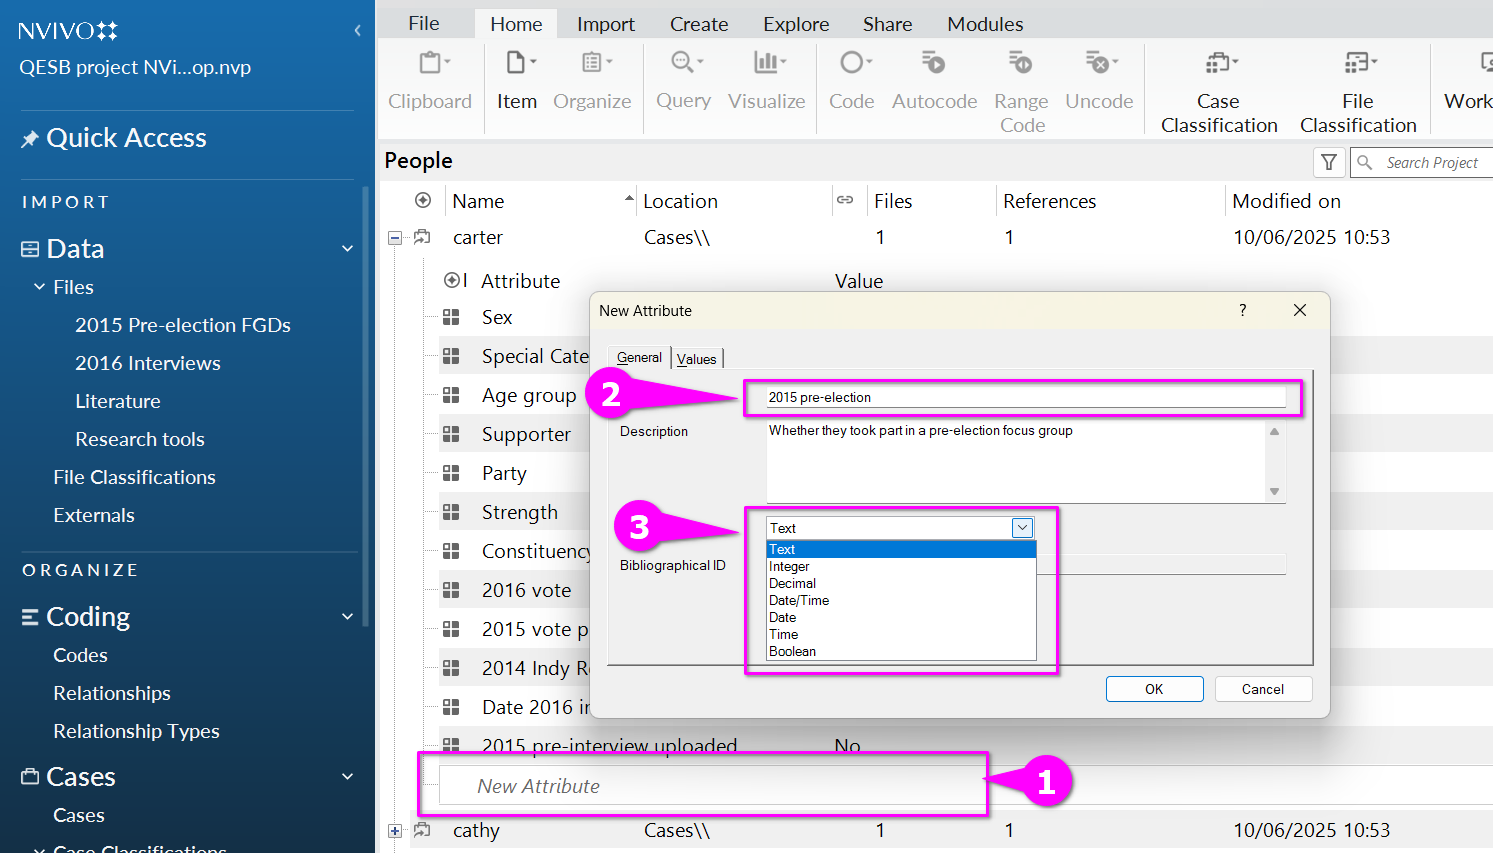
- In the ‘General’ tab, enter the name (‘2015 pre-election’) and a description, then move to the ‘Values’ tab.
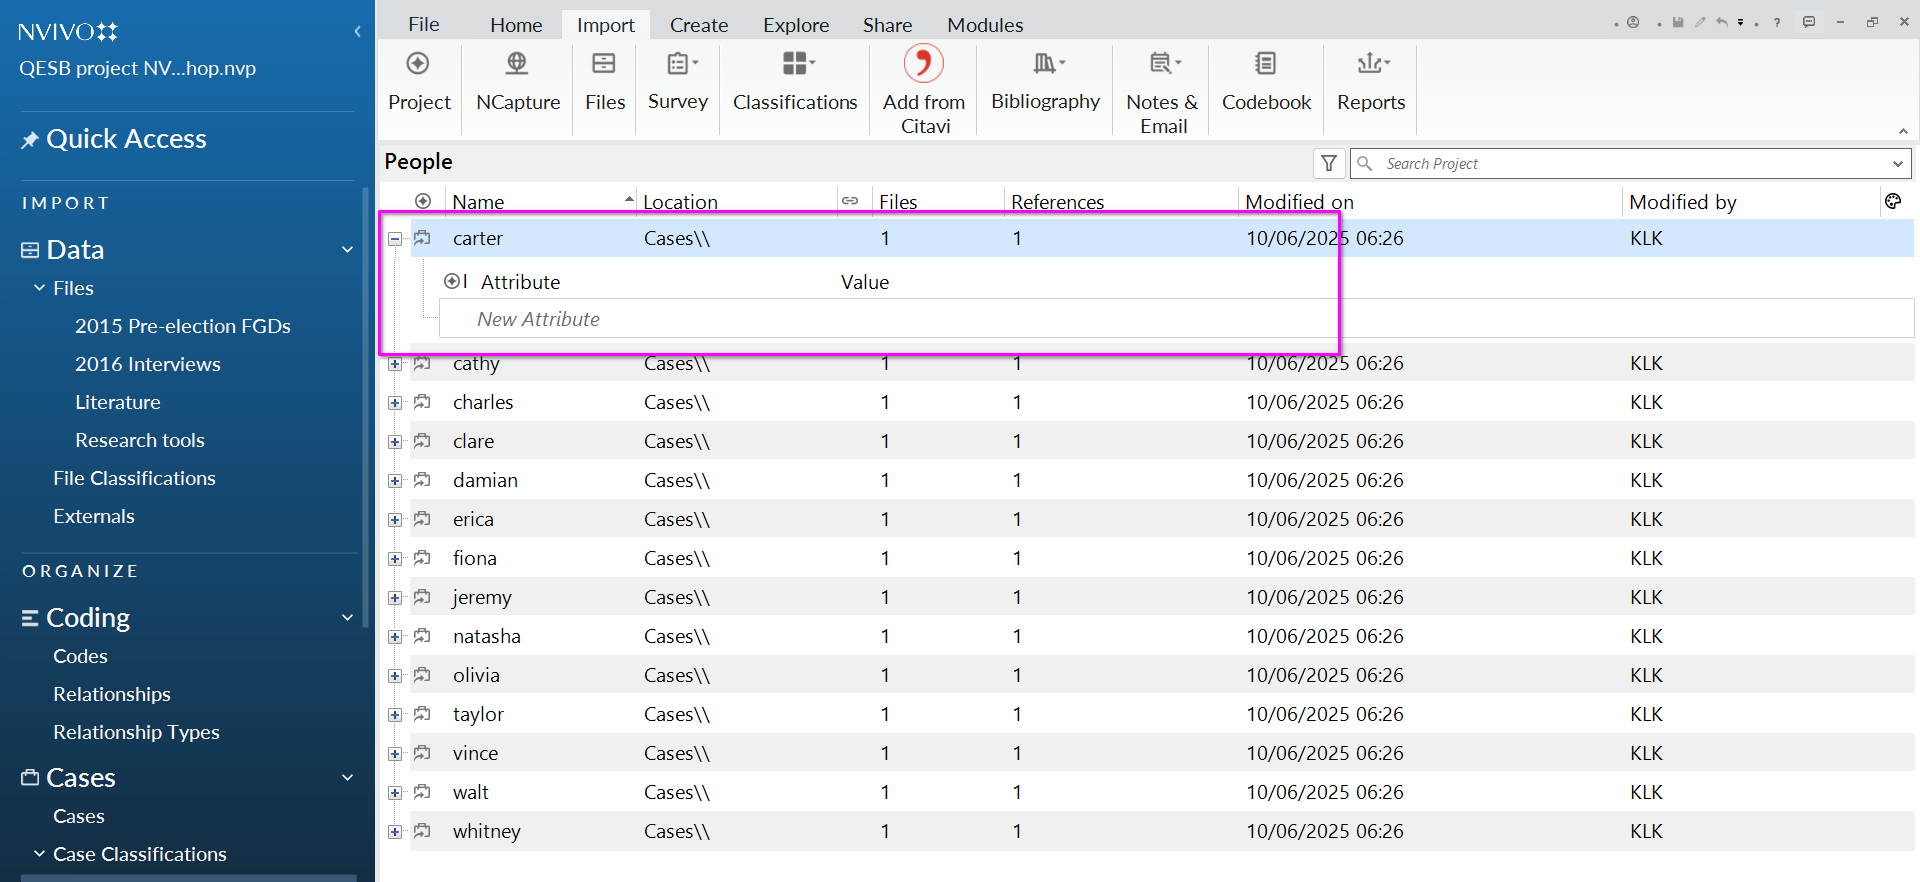
Another way to do this is, within a case, scroll to the bottom of the list of attributes and click new attribute (step 1 below)
Then follow the same steps as above
Click the values tab to assign possible options for the attribute
We are going to make this yes/ no, so click ‘Add’ -> enter ‘Yes’, ‘Add’ -> enter ‘no’
Select ‘OK’ /done:
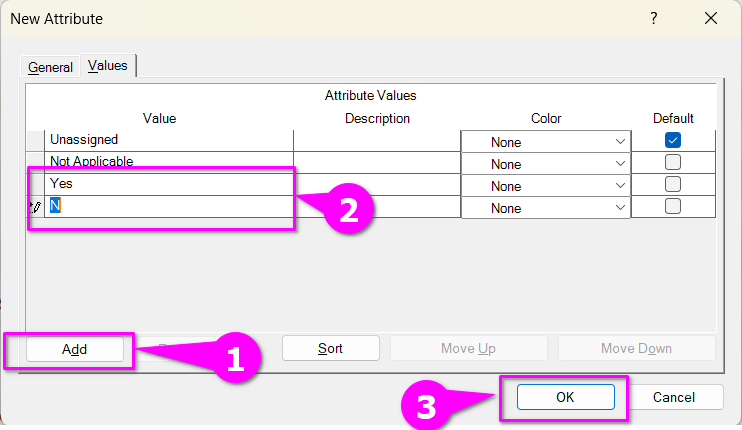
N.B. default is set to ‘unassigned’ – you can change this depending on your preference
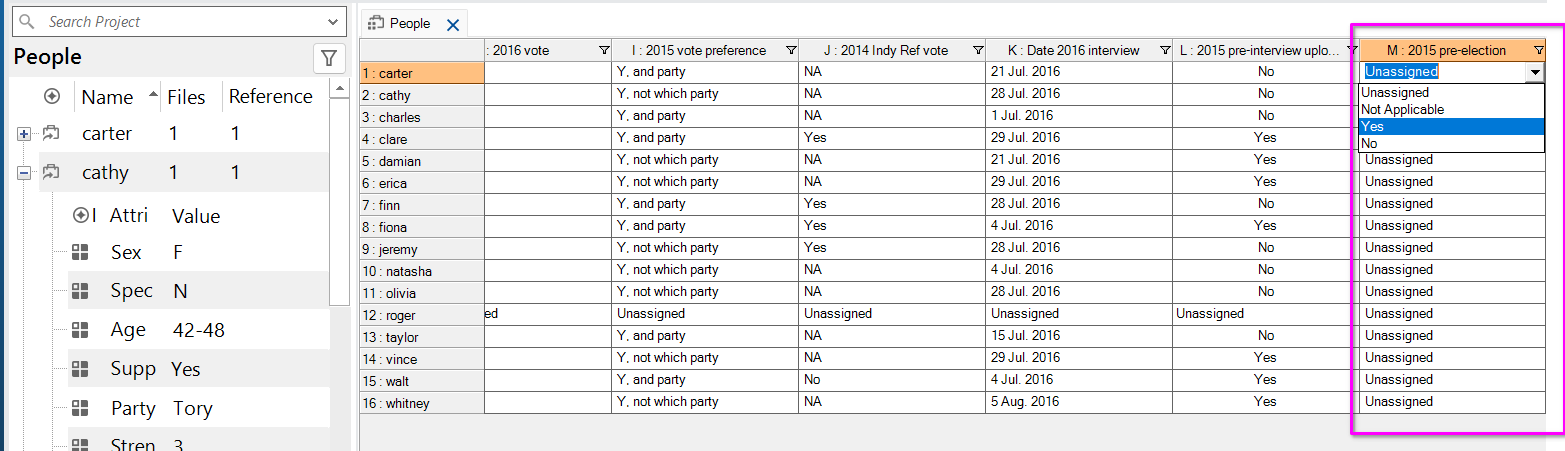
Now this column will appear as the last column in your case classifications sheet, but it is empty with no values (i.e. ‘unassigned’)
- You can set values for this new attribute by clicking on the drop-down arrow.
Summarise metadata in charts (Windows only)
Now that you have some basic information attached to the transcripts, you can summarize this in a basic way using Nvivo’s chart function. This depends very much on how the metadata in the classification sheet are formatted, but so long as this is consistent, it can be very useful for getting a quick glance at your sample composition.
For example, here we want to understand voting patterns within the sample.
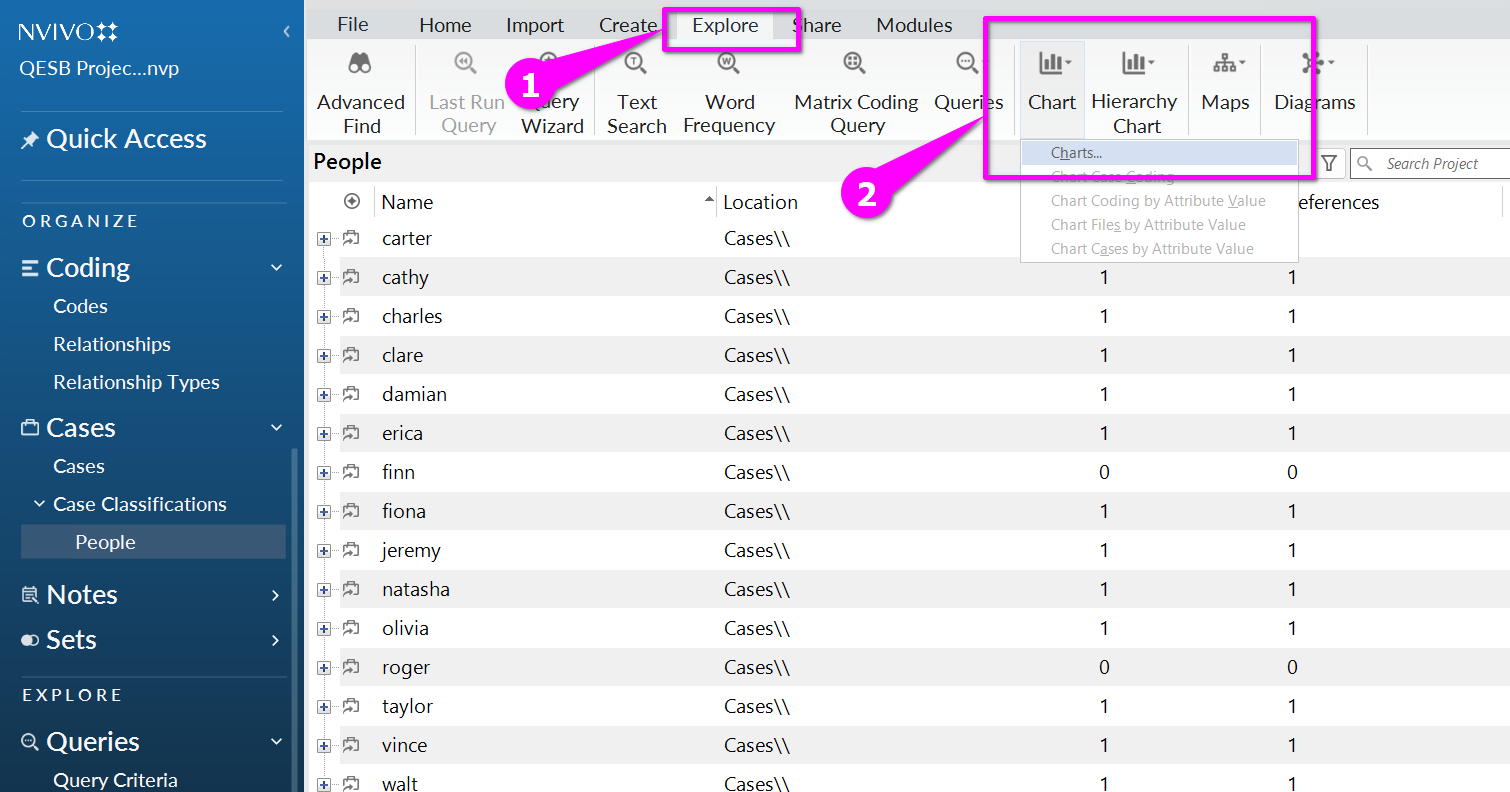
- In the top ribbon, go to the ‘Explore’ tab, and choose ‘chart’
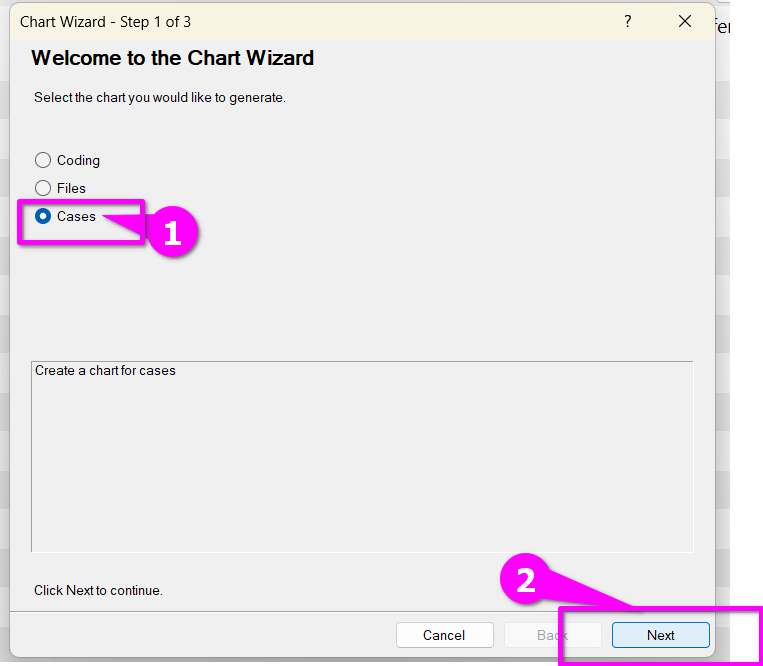
- On the chart wizard, choose ‘cases’, then ‘next’.
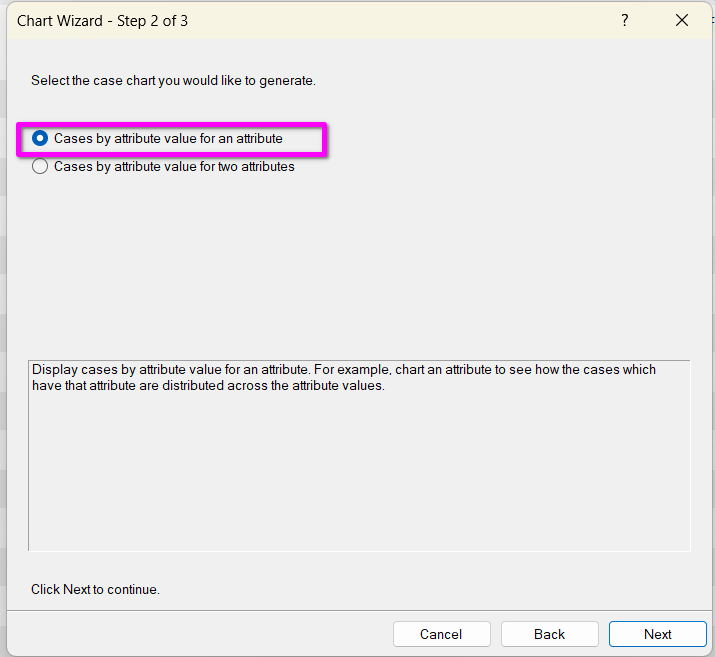
- At the next stage, choose ‘cases by attribute value for an attribute’ - this will chart the values of one attribute/variable. You have the choice to chart two attributes at the same time, this will create a 3 way bar chart. But let’s just do one at a time for this example.
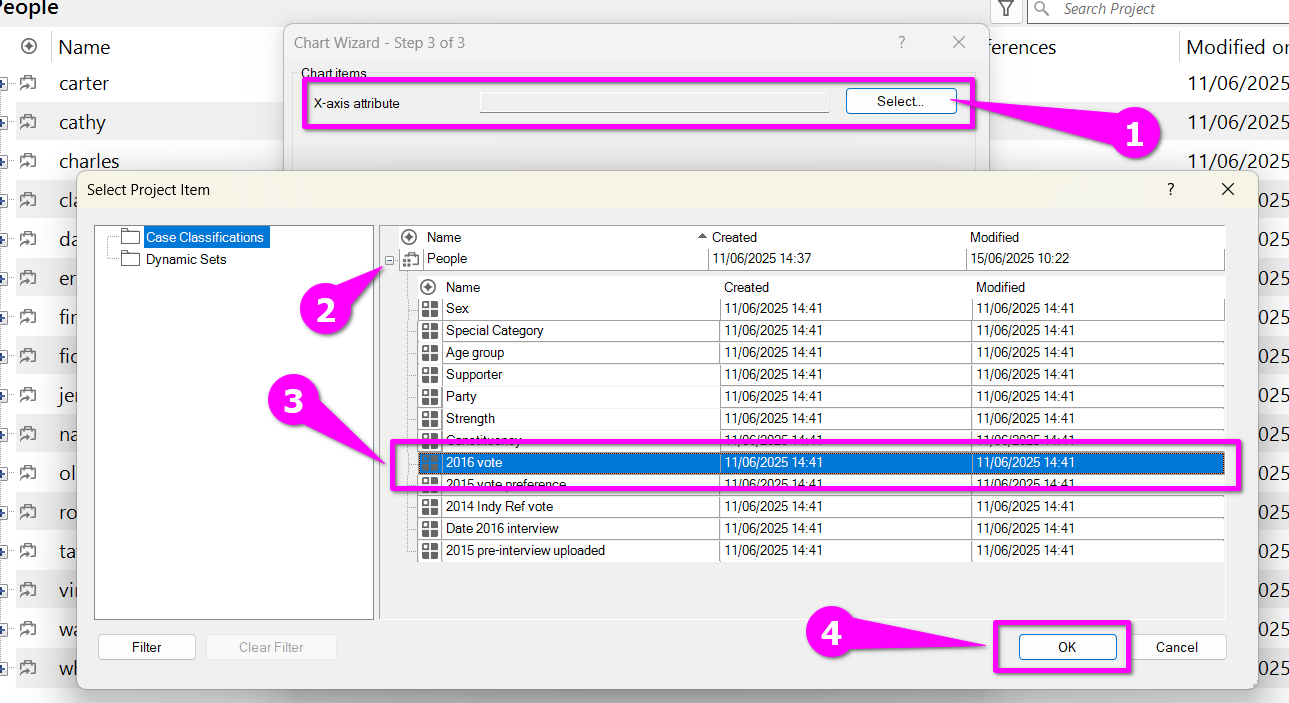
- At the next stage, select the attribute you want to chart by clicking ‘select’
- Then expand the list of attributes by clicking the plus symbol next to ‘People’
- Choose ‘2016 vote’, and click OK.
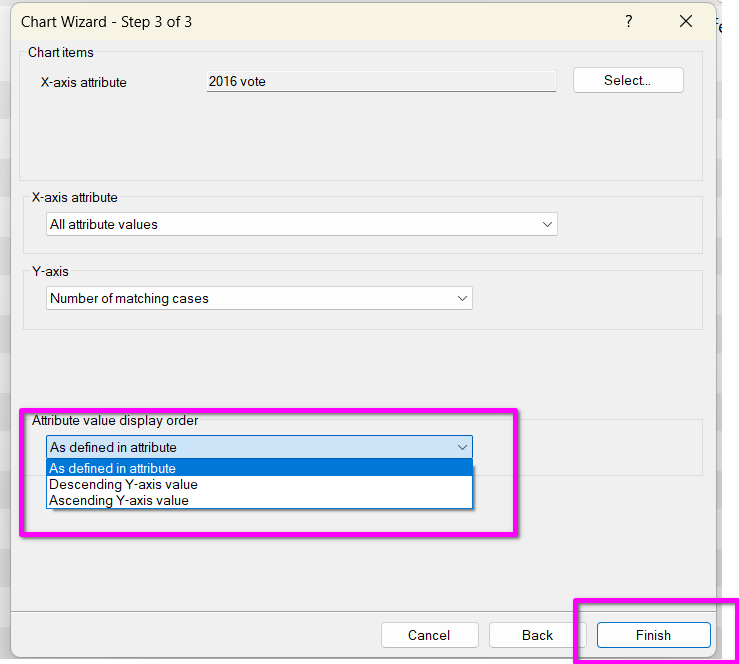
- Finally, you get the choice of how the values of the attribute are displayed on the x-axis. We leave it as the default, but you can choose alphabetical etc. Click finish.
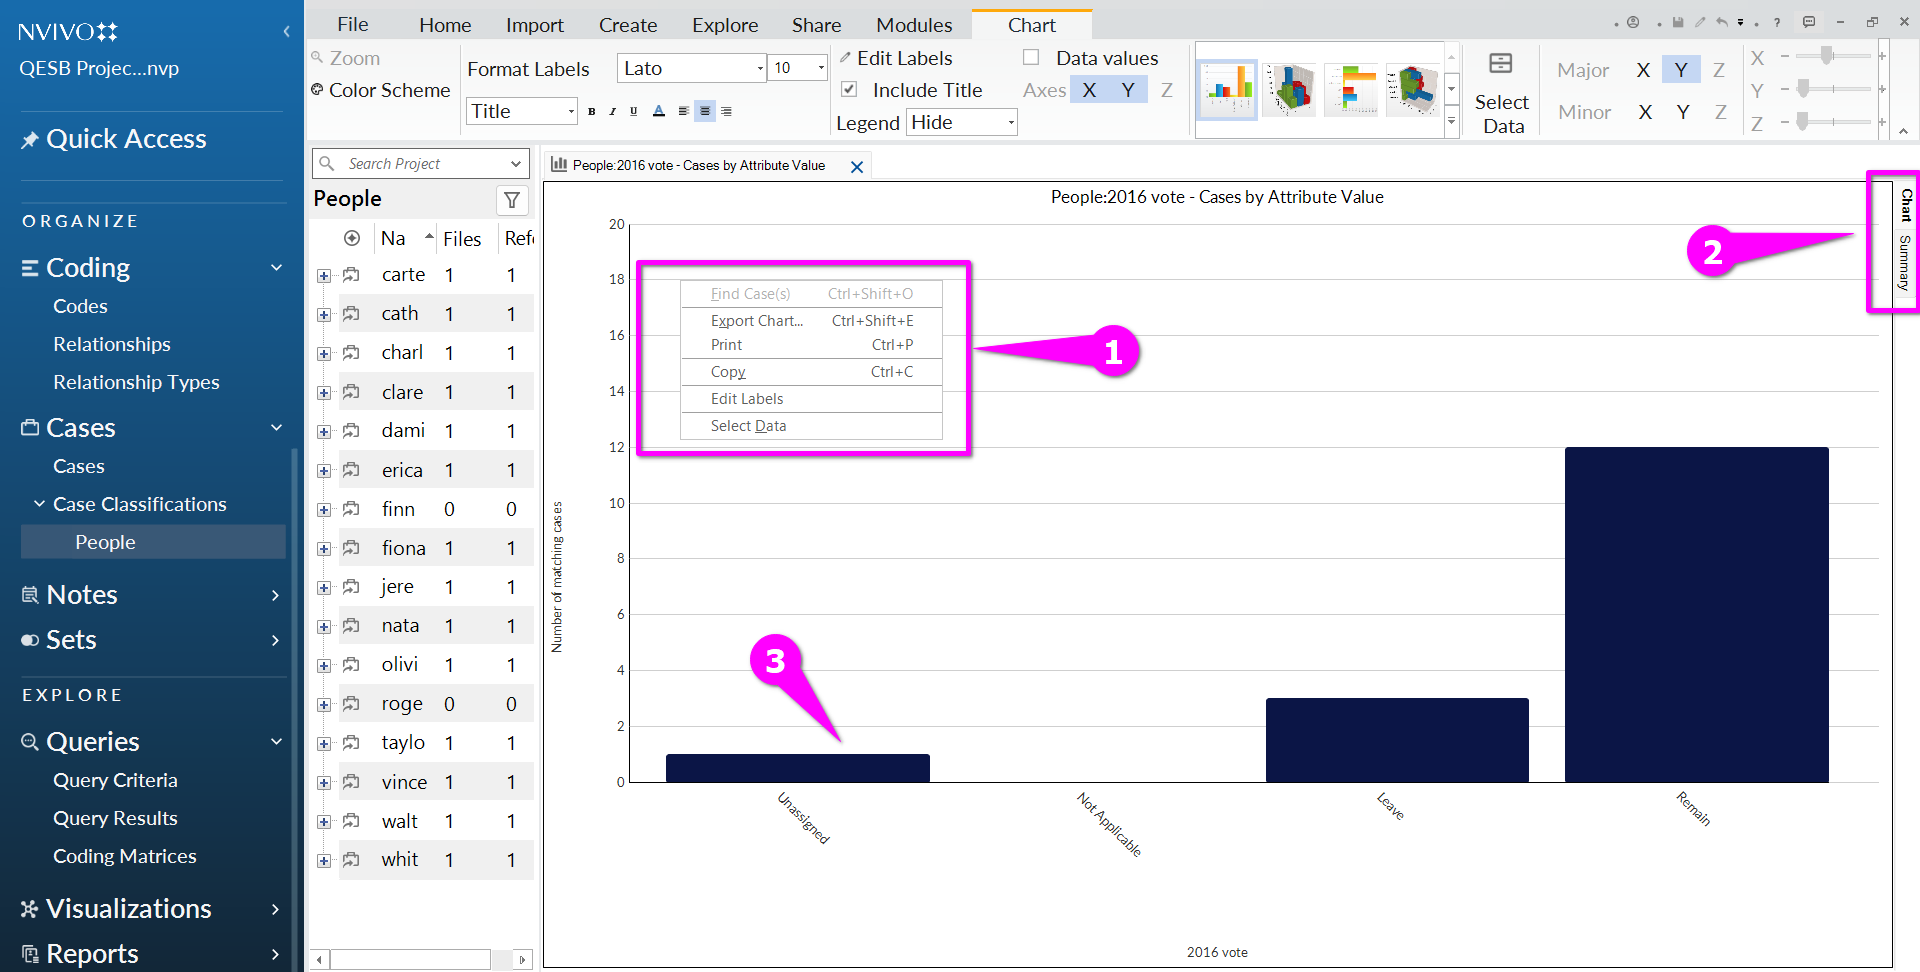
- Now you will see a simple bar chart displayed. You can edit the title, labels etc and much more in the top ribbon. You can also export or print chart (1).
- You can just see a numerical summary (rather than the bar chart) by clicking ‘summary’ on the far right of the screen (2)
- Note there is 1 case for whom this attribute is blank or ‘unassigned’- this is roger, the case we just created. (3)
- There are many more complex charts you can create once you have more complex and appropriately formatted data; you can also make charts based on codes you have created.